ArrayPipe Online Documentation
[← previous] [up ↑] [next →]Sample Analysis
Gene List
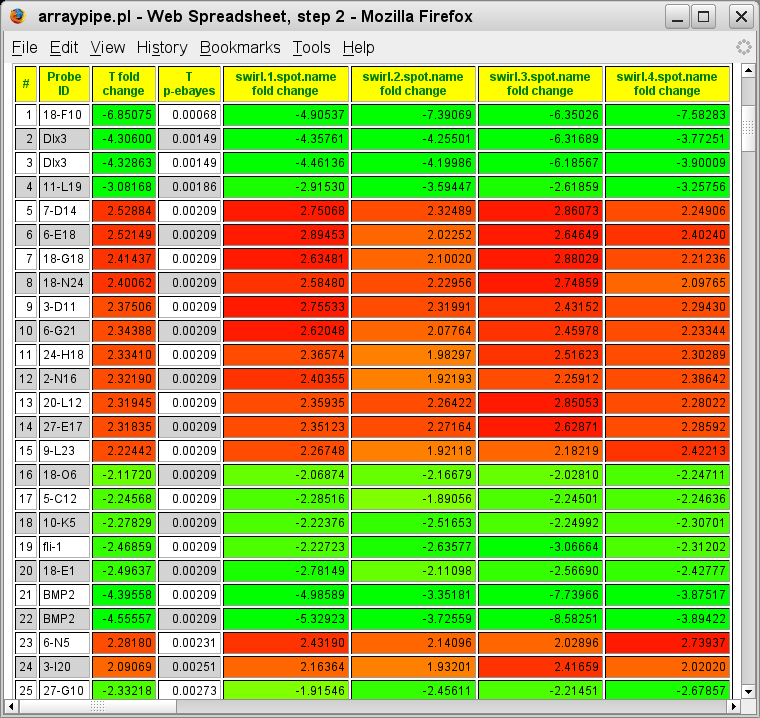
After selecting all files and clicking the 'Simple Spreadsheet View' button in the 'Retrieve data' section of the results page the following list appears:
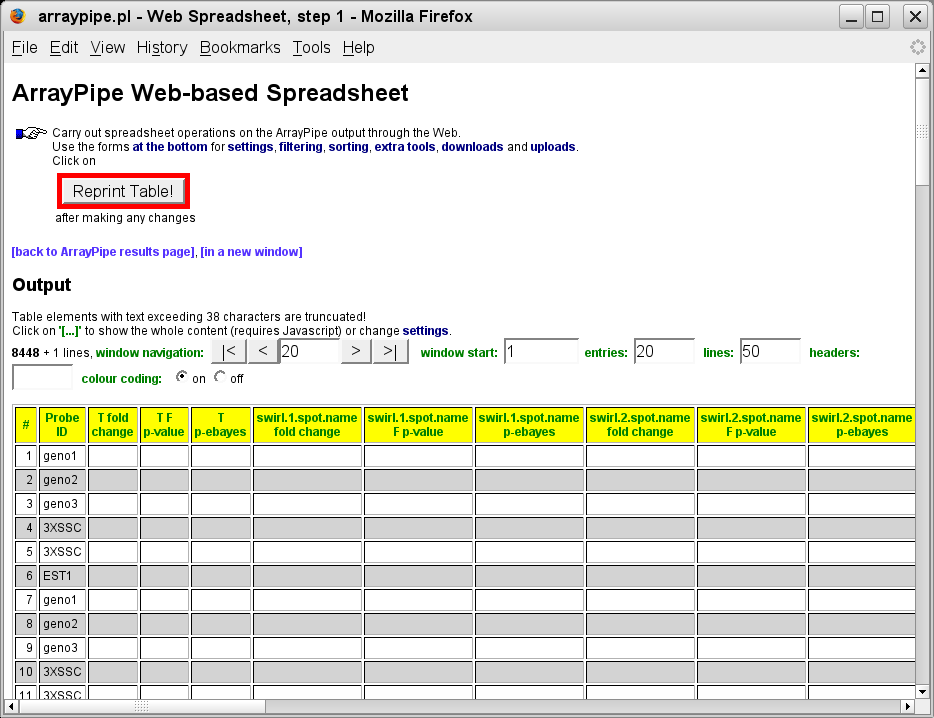
(go to original page)
This shows the first 20 spots with their fold-changes and p-values. However, since the start of each subgrid contains only control spots, which were excluded from the analysis, they don't contain any values.
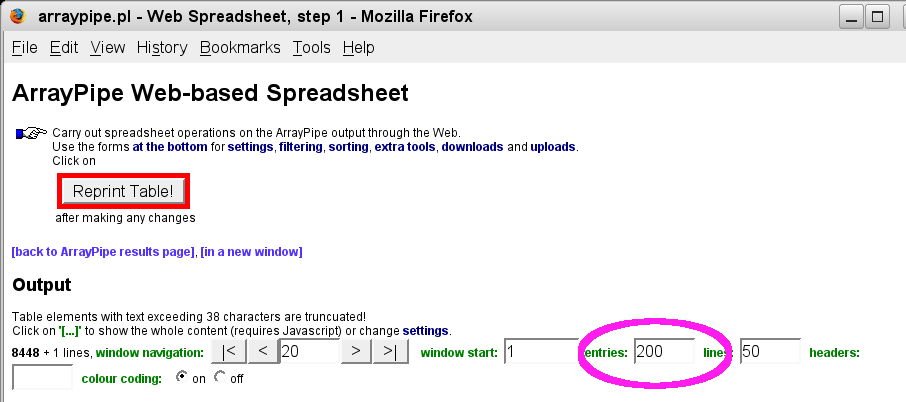
The following steps show you how to bring up the top 200 spots with p-values <= 0.05 ordered by p-value.
First we can increase the number of rows shown from 20 to 200:
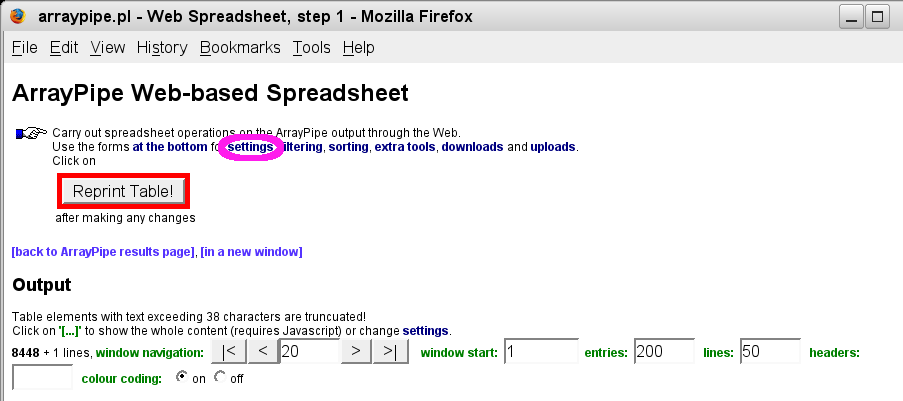
After that click on the link called 'Settings' to move to the bottom of the table where you can configure the spreadsheet:
Here, we first of all can select all the F p-value columns and also the p-ebayes columns for the replicates to be hidden:
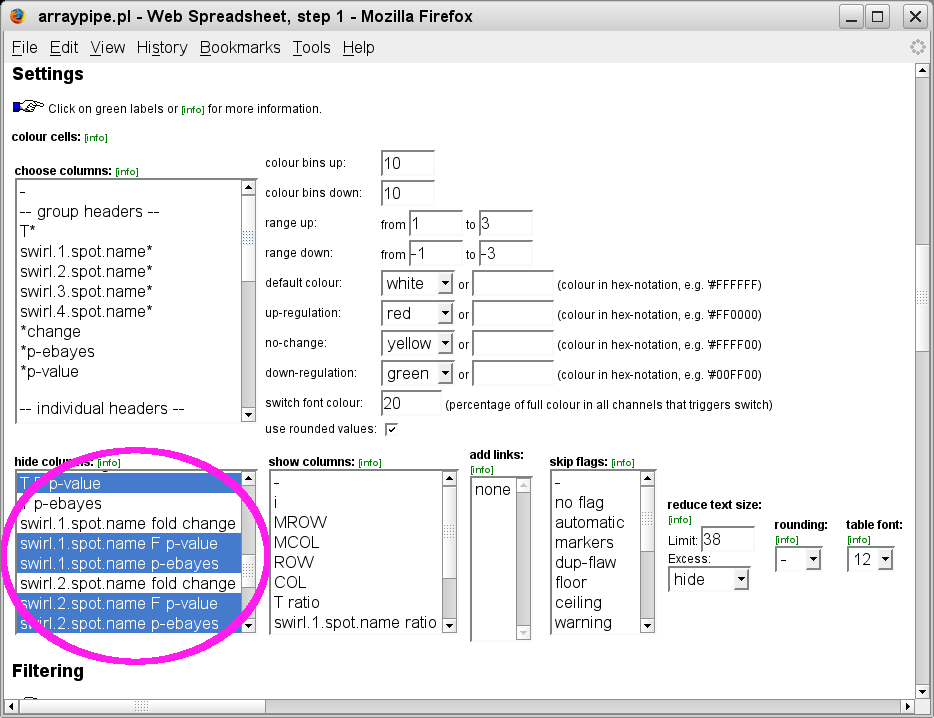
The F p-values are ANOVA-like p-values that are of less importance in this case than the p-values from
the moderated t-test with eBayes statistics, which can be found in the
p-ebayes columns.
Since p-values are always attached to each individual file they show up for
each replicate and the merged file, but we only need to see them once because
they contain the same information.
Scroll down a bit to get to the filter section:
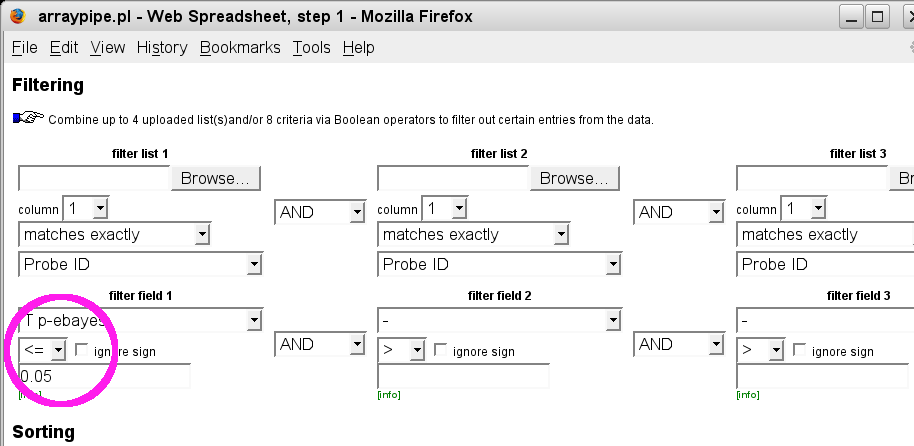
Here we specify a filter that only lets spots through that have a value of 0.05 or lower in the 'T p-ebayes' column (the p-values for the merged data).
Scroll down even further to get to the sorting section:
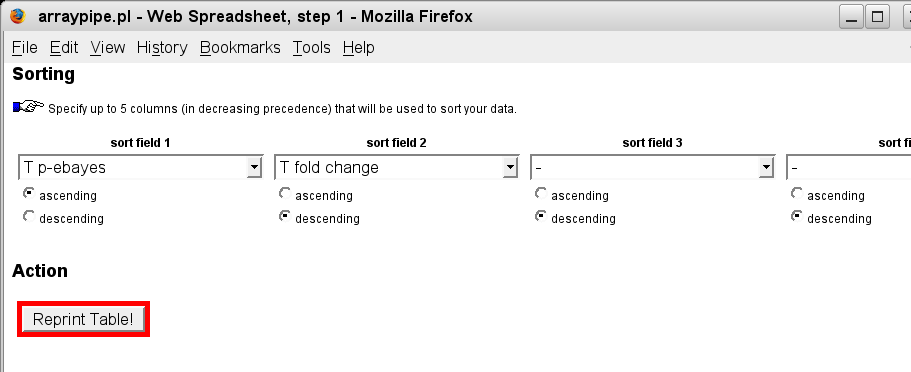
Select the 'T p-ebayes' column from the first pull-down menu and set the direction to 'ascending'. As a second criteria we can choose to sort by fold-change in descending order.
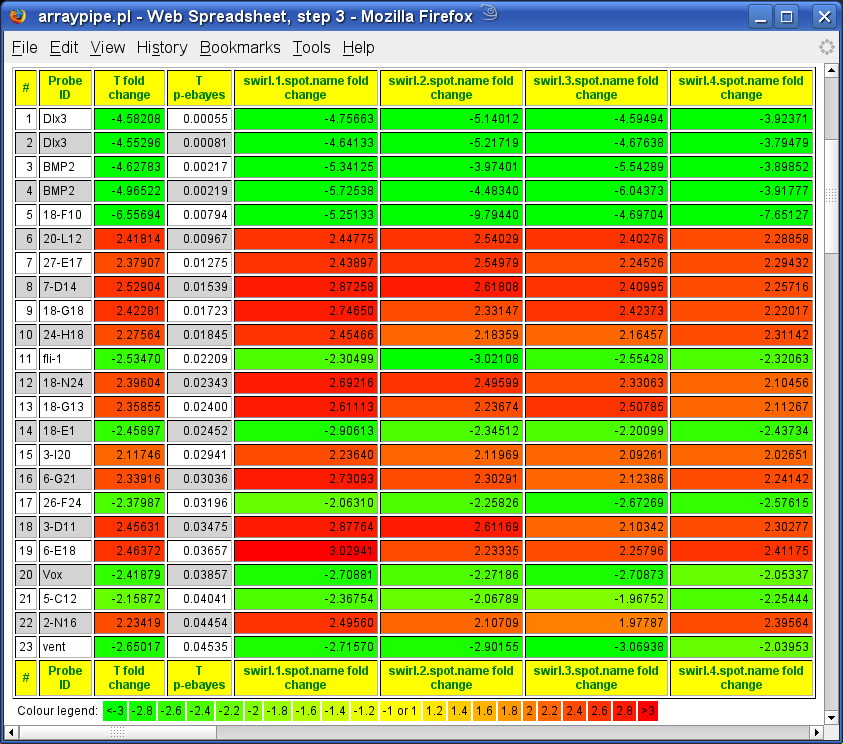
Click on the red button labelled 'Reprint Table!' to bring up the new spreadsheet:
(go to original page)
Two spots representing the 'BMP-2' gene, which is knocked out in the swirl mutant, are listed at position 21 and 22 with very high negative fold-changes. They are actually contained in the 4th highest category of p-values but appear further down in the list because the second sorting criteria was specified to be by decreasing fold-change.
The following is a list generated by ArrayPipe using slightly modified
analysis settings:
(go to original page)
This is very similar to the results shown in the LimmaGUI tutorial on the same data set.
To achieve this, the background correction was changed to 'FG - BG', markers
were not flagged, another normalization step was added (GlobalMAD) to
normalize between arrays and the averaging of the replicates was done using the mean (ArrayPipe averages using the median by default).
[← previous]
[up ↑]
[next →]
Home
for questions or remarks e-mail karsten_hokamp@sfu.ca.