ArrayPipe Online Documentation
[← previous] [up ↑] [next →]Sample Analysis
Settings Check
To make sure that the data settings are correct it is advisable to always start with some simple chip visualizations. In the ACTION SETUP section define the following steps:
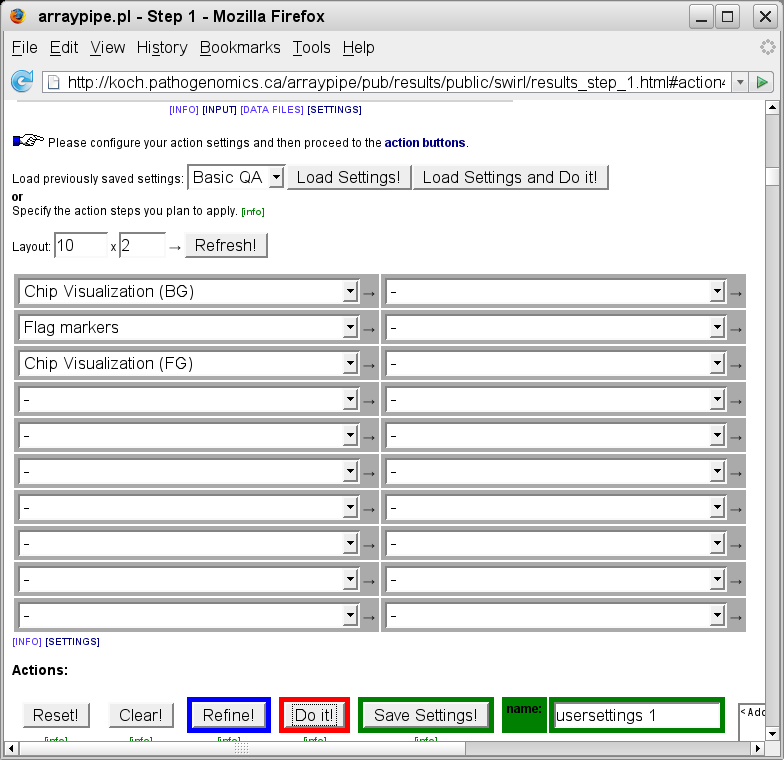
(go to original page)
After clicking on the red 'Do it!' button the data processing is started. A temporary message comes up and refreshes until the final results are available:
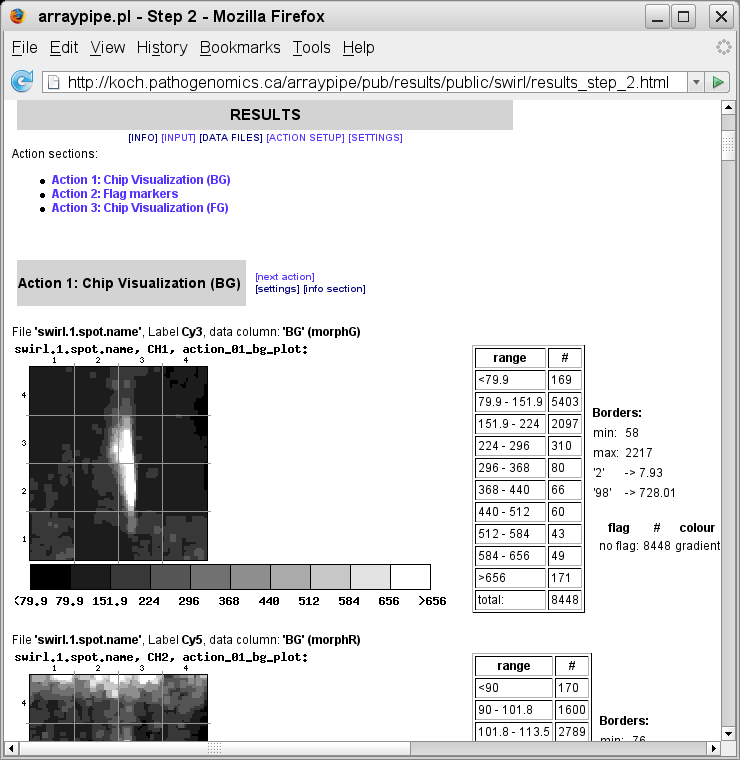
(go to original page)
The patterns visible from the background intensities span across subgrid boundaries and form a coherent picture. This confirms that the grid layout and data organization has been specified properly. With incorrect data settings, e.g. 'by-row' file organization rather than 'by-subgrid' the chip image would look like this:
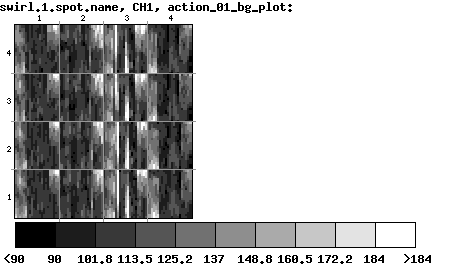
(go to original page)
This effect of repeated patterns within subgrids but no connection between them is a good indication for wrong file organization settings.
Based on the frequency of their occurrence the following spots were flagged as markers:
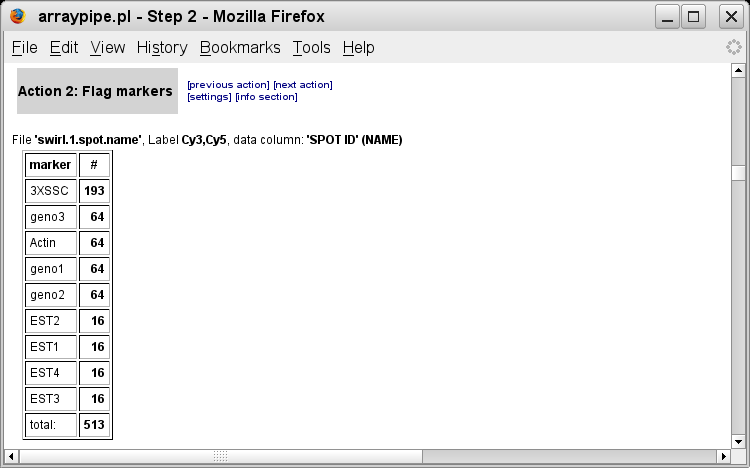
(go to original page)
These show up as magenta coloured fields on the next chip visualization:
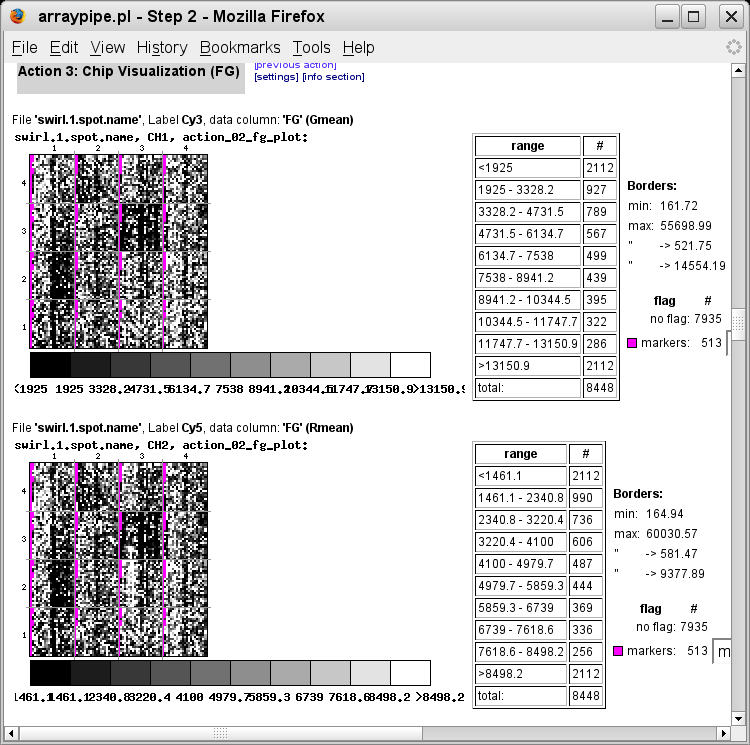
(go to original page)
Shown are the two channels from the first data file. Please note that the
images are turned onto their side by default to use space more efficiently with
larger chips. The markers are located along the top row of each subgrid, which
can be easily verified from the GAL file accompanying this data set. This
provides further confirmation that our data settings are correct!
[← previous]
[up ↑]
[next →]
Home
for questions or remarks e-mail karsten_hokamp@sfu.ca.